Master data visualization using Matplotlib and Seaborn. Learn to create compelling visualizations from basic plots to advanced statistical charts. Practice with real datasets and build visualization skills for data science, analytics, and business reporting.
This free intermediate course teaches you data visualization with Python using Matplotlib and Seaborn, two of the most widely used libraries in data science and analytics. Starting from core Matplotlib concepts like figures, axes, and basic plotting commands, you progressively build up to grouped bar charts, histograms, pie charts, and complex subplot layouts. Along the way you learn to customize every visual element, from colormaps and annotations to legends and grids, so your charts communicate clearly rather than just display numbers.
The second half of the course brings in Seaborn for statistical storytelling. You will work through categorical plots, box and violin plots, KDE distributions, regression plots, heatmaps, and correlation matrices. A dedicated module on time series visualization covers date formatting, trend detection, and seasonality, while a practical preview of interactive libraries like Plotly rounds out your toolkit. The course closes with design principles, accessibility guidelines including colorblind-friendly palettes, and how to export and share your finished visualizations.
This course suits students, analysts, researchers, and anyone who works with data and wants to turn raw numbers into clear, convincing visuals. No data science degree is required, just a working knowledge of Python basics. Completing all modules and passing the final exam earns you a certificate of completion that you can add to your LinkedIn profile or resume.
14 modules • 38 lessons
Finish every lesson and pass the final exam to earn this free, shareable certificate.
FreeAcademy.ai
Certified
Scan to verify
This certifies that
Has successfully completed
Issued June 15, 2026
Credential FA-2026-PE-SAMPLE · 12 lessons
Verify at freeacademy.ai/verify/FA-2026-PE-SAMPLE

Michail Ouroumis
Founder, FreeAcademy
Sample preview. Your name appears on the certificate when you complete the course. Learn more
The course covers Matplotlib fundamentals such as figures, axes, bar charts, histograms, and subplot layouts, then moves into Seaborn for statistical plots including box plots, violin plots, heatmaps, and correlation matrices. It also includes a module on time series visualization and a preview of interactive libraries like Plotly.
Yes, the course is completely free and requires no signup to start. You can work through all lessons at your own pace and, once you finish the course and pass the final exam, you receive a certificate of completion at no cost.
You should be comfortable writing basic Python, including variables, loops, and importing libraries. Prior experience with NumPy or Pandas is helpful but not required, as the course focuses on visualization rather than data wrangling.
You will work hands-on with Matplotlib and Seaborn throughout the course. Chart types covered include line plots, scatter plots, bar charts, histograms, pie and donut charts, box plots, violin plots, KDE plots, regression plots, heatmaps, clustermaps, and time series plots. Plotly and other interactive libraries are introduced in a preview module.
Yes. Completing all modules and passing the final exam earns you a certificate of completion, which you can download and add to your LinkedIn profile, portfolio, or resume to demonstrate your data visualization skills.

Learn to analyze financial data using Python. Master NumPy, Pandas, data visualization, portfolio analytics, technical analysis, financial modeling, and statistical analysis. Build real-world projects including an automated investment research system.
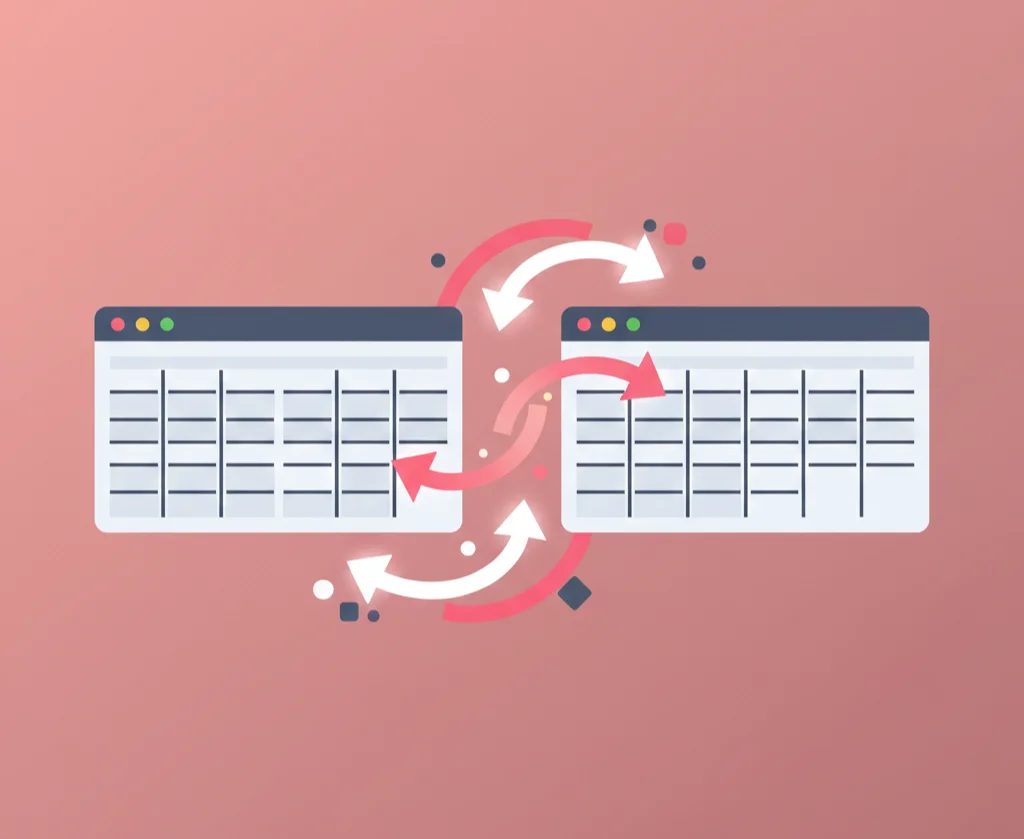
Master data analysis with Pandas through hands-on exercises. Learn to create, manipulate, filter, group, and transform DataFrames in your browser. Practice real-world data wrangling with live Python execution.

Master JSON parsing, manipulation, and transformation with hands-on exercises. Learn to navigate complex data structures, transform API responses, and build data pipelines in your browser.

Learn to analyze data using AI without writing code. Master uploading spreadsheets to ChatGPT and Claude, asking the right questions, finding patterns, creating reports, visualizing data, and cleaning messy datasets.
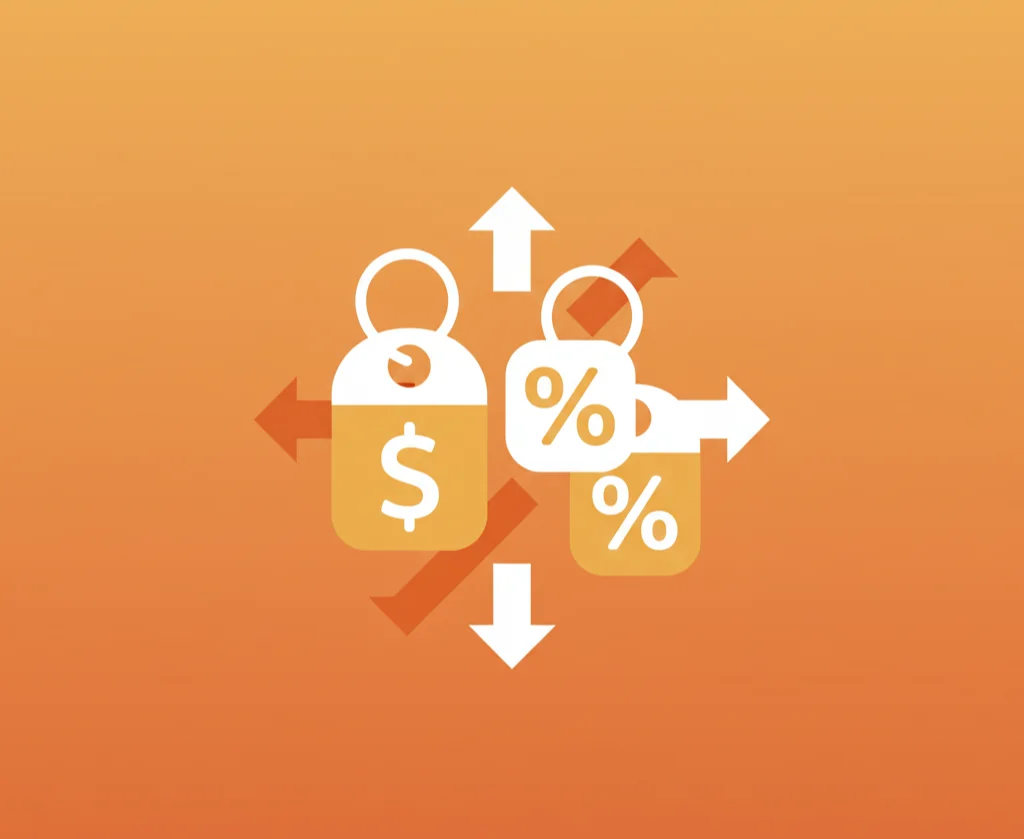
Master the art and science of pricing to maximize profitability. Learn pricing psychology, methods, policies, and execution strategies used by leading companies.
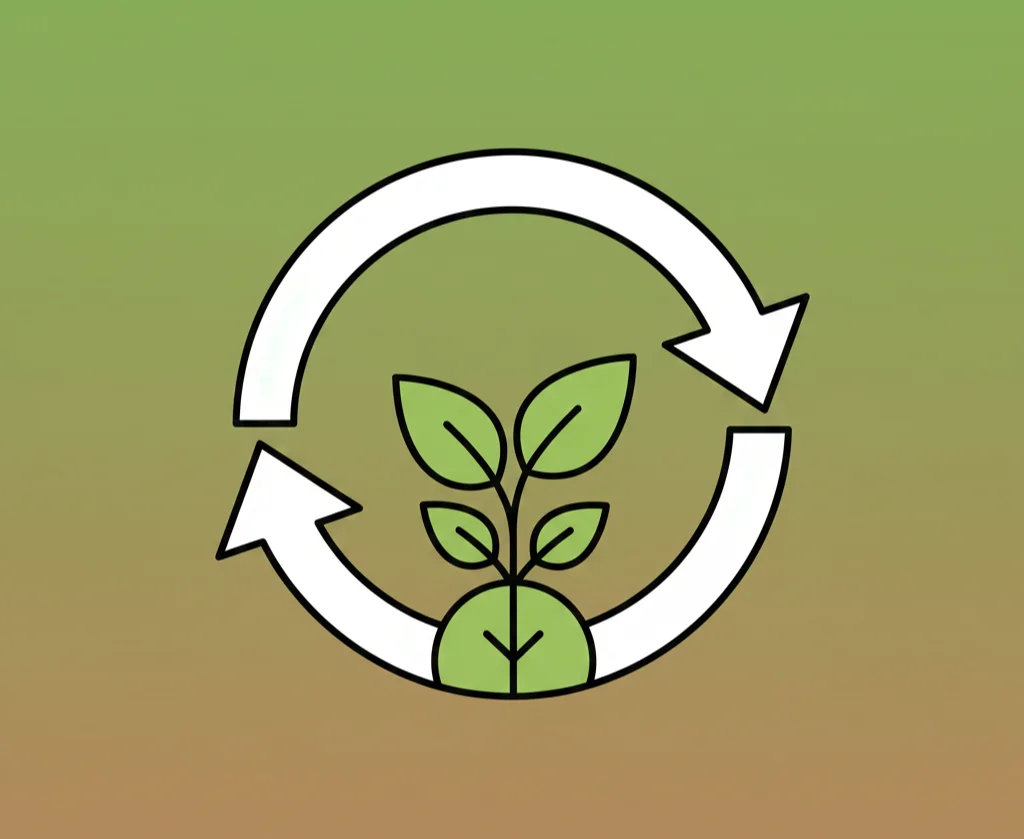
Explore the intersection of economics and sustainability. Learn how economic principles can be adapted to address environmental challenges, climate change, resource management, and social equity. Perfect for students, policymakers, and anyone interested in building a sustainable future.