

Last updated
Understand how data moves through modern systems, no code required. Learn ETL vs ELT, cloud storage with Amazon S3, AWS Glue basics, data validation, and pipeline monitoring, plus how AI tools help you design, explain, and document pipelines.
This free course gives you data engineering literacy without any coding. You learn how data actually moves through modern systems: what a data pipeline is, the difference between ETL and ELT, where data lives in cloud storage like Amazon S3, and how a service such as AWS Glue extracts, transforms, and loads data. Every idea is explained in plain language with real examples, so you can follow a pipeline discussion and understand the choices behind it.
The course is built for students, analysts, and self-learners who work near data but do not have a programming background. If you have ever wondered how a dashboard stays fresh, why raw data is never ready to use, or what people mean by a data lake, this course connects the dots. You also learn the two practices that keep pipelines trustworthy: data validation and monitoring. The final lesson shows how AI tools like ChatGPT and Claude help you understand unfamiliar pipelines, sketch a design, and write the documentation everyone skips.
Finishing the lessons and passing the final exam earns you a free certificate of completion you can add to LinkedIn or a resume. The whole course takes around 40 minutes, so you can build genuine pipeline literacy in a single sitting and speak confidently about how data flows through systems.
3 modules • 7 lessons
Finish every lesson and pass the final exam to earn this free, shareable certificate.
Certificate of Completion
has successfully completed
7 lessons · Final exam passed

Michail Ouroumis
Founder, FreeAcademy.ai
Sample preview. Your name appears on the certificate when you complete the course. Learn more
Teaching a class or training a team? Assign this course for free
It covers data pipeline literacy in one short module: what a pipeline is, ETL versus ELT, cloud storage with Amazon S3, AWS Glue basics, data validation, and monitoring. The final lesson shows how AI tools help you understand, design, and document pipelines. Everything is conceptual and no-code.
Yes, the course is completely free and needs no account to start. Completing the lessons and passing the final exam earns you a certificate of completion at no cost.
No. This is a beginner course built for students and analysts with no programming background. If you can read a chart and follow a simple example, you have everything you need. The goal is literacy, not building production systems.
No, this is a conceptual, no-code course. You learn how pipelines and tools like S3 and AWS Glue work so the terms make sense when you meet them, without setting up any cloud accounts or writing code.
Good next steps are the Use AI for Data Analysis (No Code) course to turn clean data into insights, and Build Your First AI Data App with Python for a hands-on step into building with data. Both follow naturally once you understand how data flows.
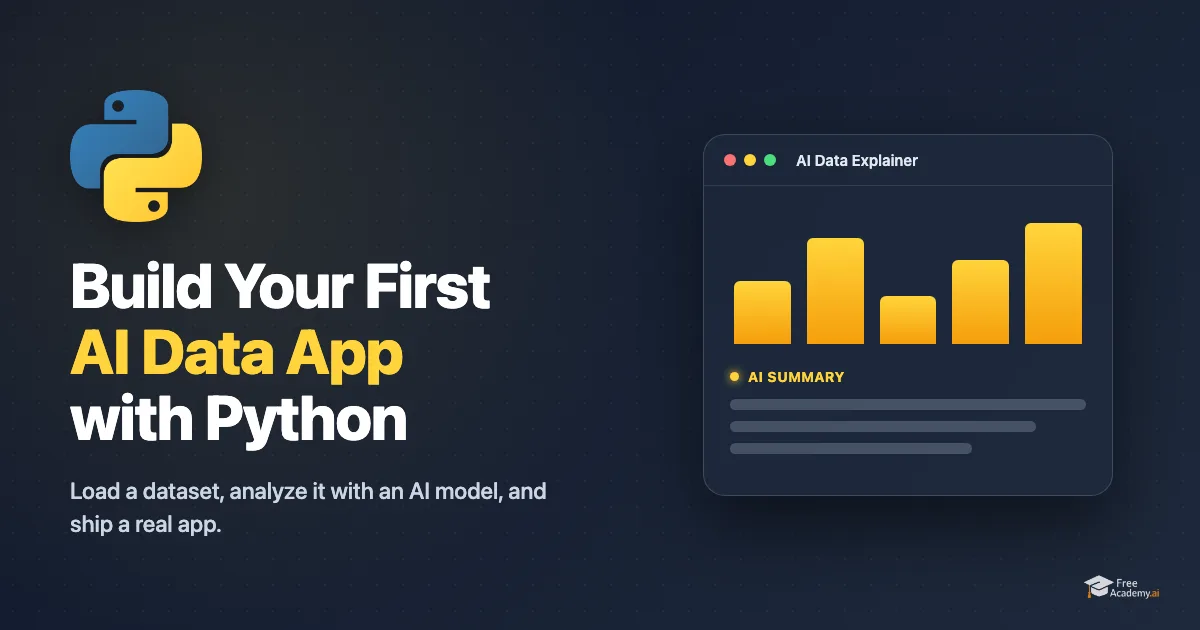
Already know basic Python? Build one real thing end to end: a small AI data app that loads a dataset, sends a slice of it to a language model, and turns the response into a written analysis. You will use pandas only as much as the app needs, call an LLM API directly (no agents, no frameworks), wire the pieces into a single script with real error handling, and ship it as a shareable Streamlit app you can run locally. A project-based intermediate course with a free certificate of completion.
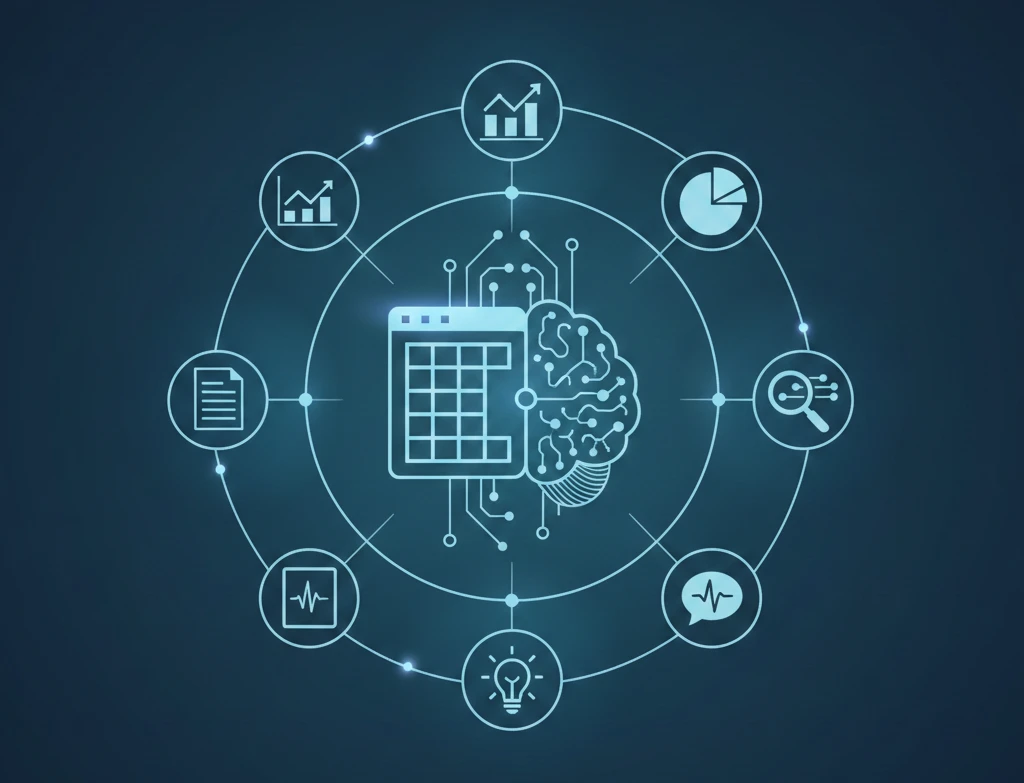
Learn to analyze data using AI without writing code. Master uploading spreadsheets to ChatGPT and Claude, asking the right questions, finding patterns, creating reports, visualizing data, and cleaning messy datasets.
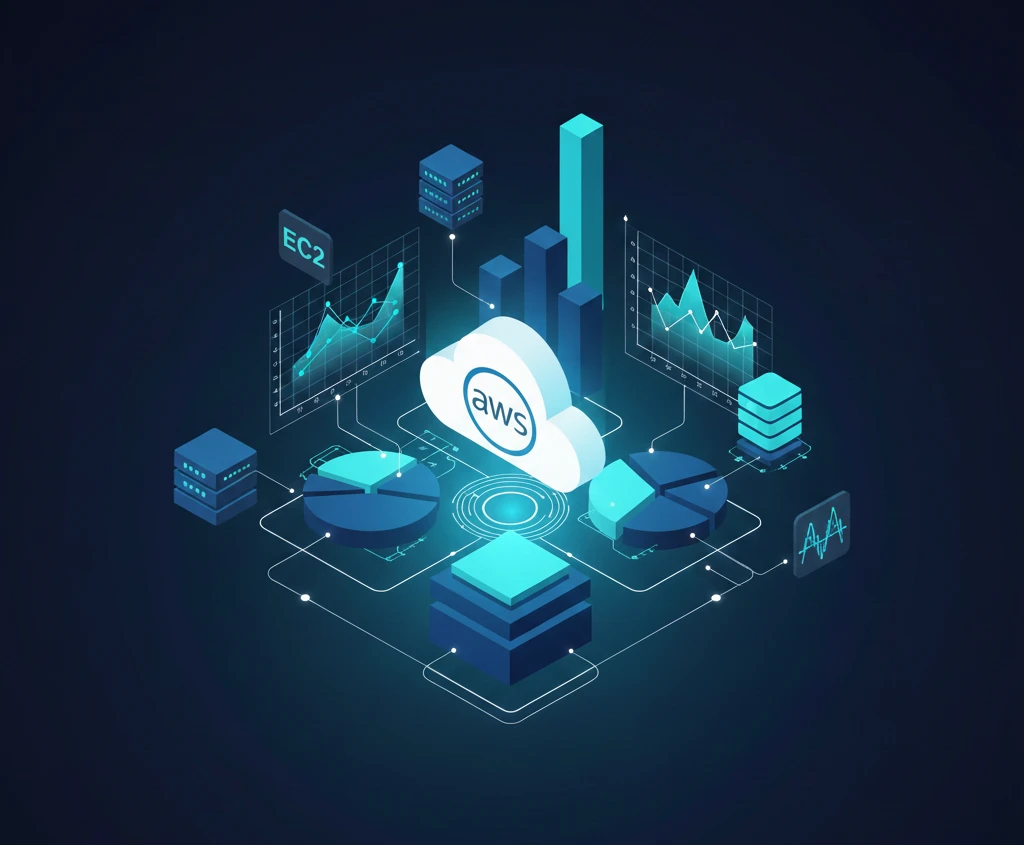
Master the fundamentals of Amazon Web Services (AWS). Learn about cloud computing basics, core AWS services including EC2, S3, RDS, and Lambda, security best practices, and cost management. Perfect for developers, IT professionals, and anyone starting their cloud journey.
Learn how to use AI tools to transform your work as a data analyst. Discover practical techniques for SQL generation, data cleaning, building dashboards, and communicating insights. No extra coding required.

Learn to clean messy data using AI without writing any code. Spot data problems, fix inconsistent text, handle missing values and duplicates, reformat columns, and build a reusable cleaning workflow with ChatGPT and Claude.

Learn to analyze financial data using Python. Master NumPy, Pandas, data visualization, portfolio analytics, technical analysis, financial modeling, and statistical analysis. Build real-world projects including an automated investment research system.