
How to Check AI Data Analysis: 6 Steps Before You Trust the Numbers

Upload a spreadsheet to ChatGPT, Claude or Gemini and you get a neat answer in seconds: a table, a chart and a paragraph that sounds ready for your thesis. The trouble is that a wrong percentage looks exactly like a right one.
This guide shows you how to check AI data analysis against your own file. You need the original spreadsheet and Excel or Google Sheets. You do not need to write code.
If you are checking general facts, quotes or sources, use our checklist for verifying AI answers. This post is only about numbers, charts and the words written about them.
Why this check matters
Data analysis is one of the main things researchers ask AI to do. In a study of 207,049 research sessions on consumer plans, Anthropic found that data analysis made up 33.7% of sessions on Claude and 48.1% on Claude Code. It estimated that data analysis takes 27.6% of researcher time.
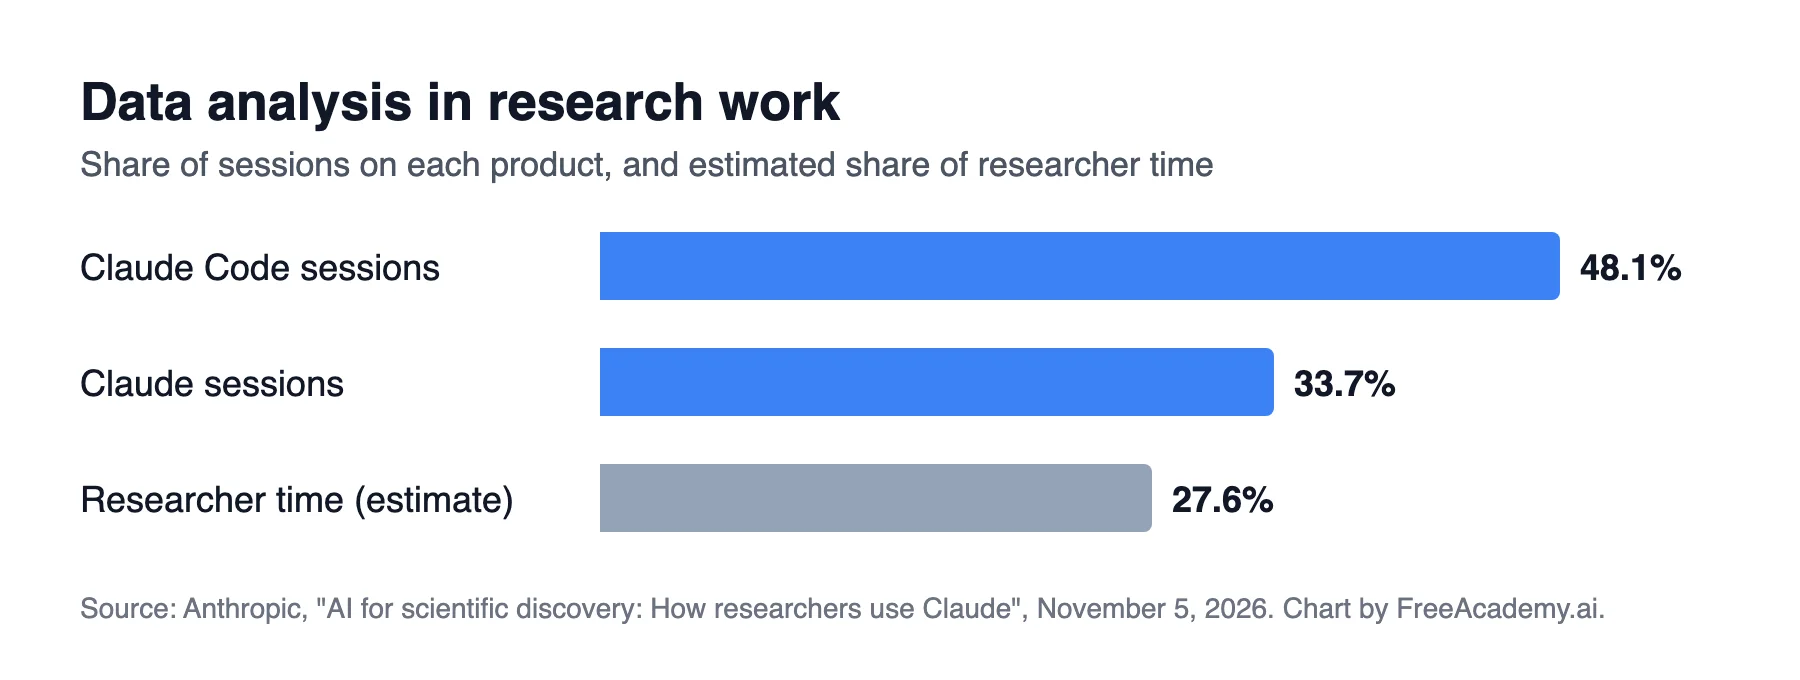
Data analysis as a share of research sessions and estimated researcher time. Our chart, built from the published figures. Source: Anthropic, "AI for scientific discovery: How researchers use Claude", November 5, 2026.
Those are shares of sessions. They show what people asked for, not whether the answers were right or whether the work went faster. Checking the answers is still your job, and your name is the one on the thesis.
Before you start
Keep an untouched copy of your original file, then do your checks in a second copy. Three small habits make the rest easier:
- Save the AI's full answer. You need the exact figures and wording to compare.
- Ask how it got each number. Use the prompt below.
- Write your checks in a new sheet. Then you have a record if your supervisor asks.
For each number in your analysis, list:
1. The sheet and column names you used
2. Any rows you removed or filtered, and why
3. How you handled blank cells
4. The exact calculation, including the top and bottom number of each percentage
Do not recalculate or change any results. Only describe what you did.
Its description can be wrong too. It simply gives you a clear list of claims to test.
The example used in this guide
Imagine a student survey with 412 responses. The file has a header in row 1 and data in rows 2 to 413. Column C holds the answers to "Did you use the tutoring service?"
The AI writes: "36% of students used the tutoring service." Keep that sentence in mind for step 3.
Step 1: Check row counts and totals
Start here, because a wrong count can spoil everything after it. Ask the AI how many rows and columns it read, then compare with your file.
| What to check | Formula or action |
|---|---|
| Number of responses | =COUNTA(A2:A413) on a column that is never blank |
| Blank answers | =COUNTBLANK(C2:C413) |
| Total of a number column | =SUM(D2:D413) |
| Lowest and highest value | =MIN(D2:D413) and =MAX(D2:D413) |
Red flags:
- The AI read fewer rows than your file has.
- You have several sheets and it only used the first one.
- A title row or a "Total" row at the bottom was counted as a response.
- It removed duplicates or outliers without telling you.
- The highest value is impossible, such as an age of 999. Some files use 99 or 999 to mean "missing", and those codes will push an average up.
Step 2: Recompute two or three figures
Pick three figures: your main finding, one ordinary number and the one that surprises you most. Calculate each one yourself.
| AI figure | Check with |
|---|---|
| Count of an answer | =COUNTIF(C2:C413,"Yes") |
| Average | =AVERAGE(D2:D413) |
| Average for one group | =AVERAGEIF(B2:B413,"Year 1",D2:D413) |
| Median | =MEDIAN(D2:D413) |
If your result is close but not equal, check rounding first. If it is clearly different, do not ask the AI to "fix it" and move on. Find out why. Common causes are numbers stored as text, spelling differences such as "Yes" and "yes ", and blank cells treated as zero.
A match on three figures is good evidence, not proof. Any number you will publish or submit needs its own check.
Step 3: Check every denominator
The denominator is the bottom number of a percentage. It is the most common place for a correct calculation to answer the wrong question.
Back to the tutoring question. The counts are:
| Answer | Count |
|---|---|
| Yes | 148 |
| No | 201 |
| Blank | 63 |
| Total | 412 |
Both of these are correct arithmetic:
- 148 out of all 412 responses is 35.9%.
- 148 out of the 349 people who answered is 42.4%.
The AI's "36% of students" used all 412 and quietly counted the 63 blanks as people who did not use the service. Neither number is wrong by itself, but you have to choose one and say which. In your write-up, report the base: "42.4% of those who answered (n = 349)".
Also check:
- Do the categories add up? Percentages for a single-choice question should total about 100%. Multi-select questions can go over 100%, and that is fine.
- Is a subgroup using the right base? "60% of first-year students" must divide by first-year students, not by everyone.
- Is it points or percent? A move from 20% to 25% is 5 percentage points, but it is a 25% increase. AI summaries often mix these up.
Step 4: Check chart axes and missing categories
A chart can use correct numbers and still mislead. Ask the AI for the table behind the chart, then go through this list:
- Does each bar or point match your own count? Compare at least the largest and smallest.
- Does a bar chart's axis start at zero? A bar axis that starts at 40 makes a small gap look huge.
- Are the labels on the right values? Swapped legends and groups are easy to miss.
- Is any category missing? Small groups, "Other" and blanks often vanish. Add up the bars and compare with your total.
- Is the order sensible? "Agree" and "Disagree" should follow the scale, not the alphabet. Months should follow the calendar.
- Does the title claim too much? "Tutoring improves grades" is a claim. "Average grade by tutoring use" is a description.
- Are the units right? Look for mix-ups between counts and percentages, or thousands and millions.
For your final version, it is often safest to rebuild the chart in Excel or Sheets from numbers you have already checked.
Step 5: Check that the written summary matches the file
This step catches errors the math checks miss. Go through the AI's summary one sentence at a time and mark each number or claim as matched, wrong or not in the data.
Watch these words closely:
| Word in the summary | What must be true |
|---|---|
| "Most" or "majority" | More than half, using a base you can name |
| "Doubled" | The later value really is about twice the earlier one |
| "Significant" | A real statistical test was run, if you mean it in the statistical sense |
| "Because", "led to", "improved" | Your study design supports cause and effect |
| "Students", "people", "all users" | The claim fits who is actually in your sample |
Also look for what was left out. AI summaries often drop small samples, low response rates and results that do not fit the main story. If a group has only 8 people, its percentages should not be presented like a firm finding.
Step 6: Spot invented columns and values
An AI can mention a column, category or quote that sounds right but is not in your file. This check is quick:
- Compare every column the AI names with the real header row. A renamed column can be harmless, but a new one needs an explanation.
- Use Find (Ctrl+F, or Cmd+F on Mac) to search for each category, place, date or group it mentions.
- If it quotes open-ended answers, search for a few exact words from each quote. A quote you cannot find must not go in your work.
- Check that dates and values fall inside the real range from step 1.
- Be suspicious of a result for something you never measured, such as income in a survey that did not ask about it.
If something cannot be traced back to a cell, remove it.
Your quick checklist
| # | Check | Pass when |
|---|---|---|
| 1 | Rows and totals | The AI used the same rows, sheets and totals as your file |
| 2 | Recomputed figures | Your main, ordinary and surprising figures all match |
| 3 | Denominators | Every percentage has a clear, correct base |
| 4 | Charts | Values, axes, labels and categories match your data |
| 5 | Written summary | Every sentence can be traced to a checked number |
| 6 | Invented details | Every column, value and quote exists in the file |
When a check fails
Tell the AI exactly what you found, and give it the correct number from your spreadsheet:
My spreadsheet shows 148 "Yes" answers and 349 non-blank answers in column C.
Your summary says 36% of students. Explain which base you used.
Then list every other figure that used the same base.
Do not change anything else.
Then check the corrected figures again. If several checks fail, start a new chat and re-upload a cleaner file. Messy files cause many of these errors, and our free AI for Data Cleaning course shows how to fix them first.
Two more rules for research work:
- Protect people's data. Remove names, emails and ID numbers, and check your ethics approval and university rules before you upload participant data.
- Follow your institution's AI policy. Many universities and journals have rules on how AI use must be declared.
Keep learning
These checks come after the analysis. To get better results in the first place, take Use AI for Data Analysis (No Code), which covers uploading a file, asking good questions, and building reports and charts. If you are writing a thesis or paper, AI for Academic Research & Papers covers the wider research process.
The AI can do the first draft of the analysis. The spreadsheet is how you find out whether that draft is true.
Enjoyed this article?
Join The FreeAcademy Weekly
One practical AI email every Tuesday. New free courses, AI tips, and a short note from the founder.
Free forever. Unsubscribe anytime.
Related articles
How to Verify AI Output: A Checklist Before You Trust Any Answer
A short checklist to run before you trust an AI answer. Six plain-language questions that catch most mistakes, no coding or technical background needed.

Best AI Tools for Excel in 2026: Copilot, Gemini, ChatGPT and Claude Compared
Copilot in Excel, Gemini in Sheets, ChatGPT and Claude compared for formulas, data cleaning, analysis and messy workbooks, with free vs paid and privacy notes.
Python for Finance Professionals: A Complete Guide to Data Analysis
Learn how finance professionals can leverage Python for data analysis, automate financial reports, and perform portfolio analysis.