

Learn to analyze financial data using Python. Master NumPy, Pandas, data visualization, portfolio analytics, technical analysis, financial modeling, and statistical analysis. Build real-world projects including an automated investment research system.
13 módulos • 26 aulas

Master data visualization using Matplotlib and Seaborn. Learn to create compelling visualizations from basic plots to advanced statistical charts. Practice with real datasets and build visualization skills for data science, analytics, and business reporting.
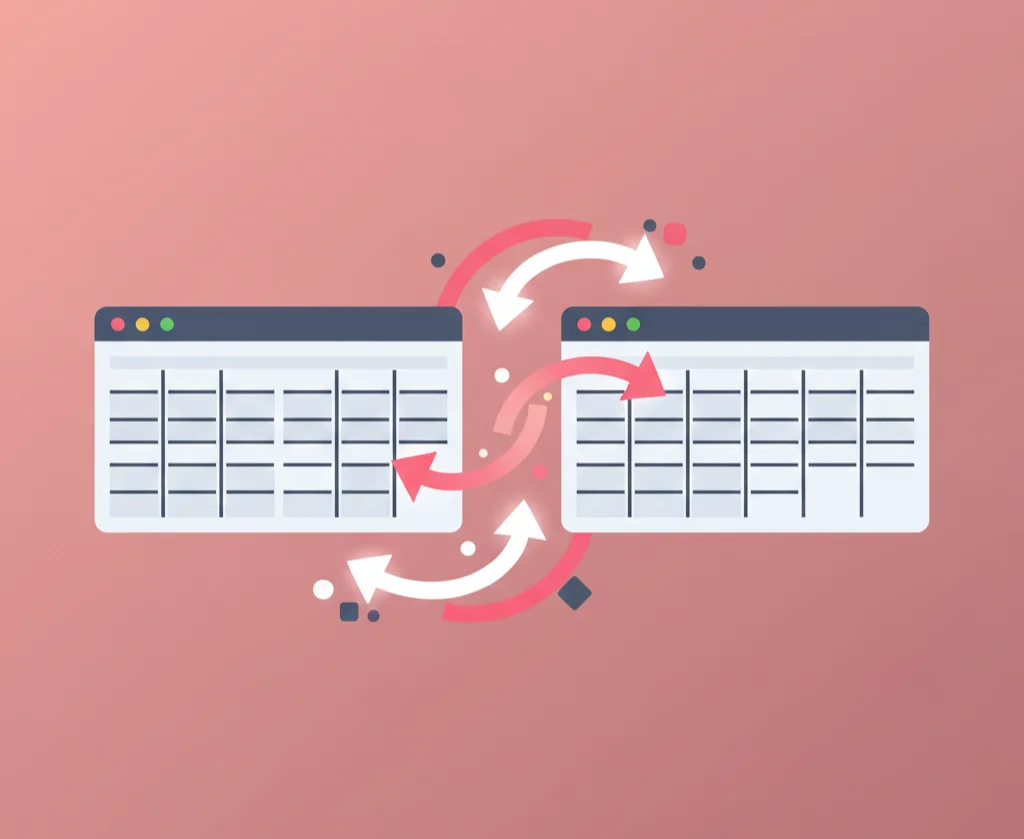
Master data analysis with Pandas through hands-on exercises. Learn to create, manipulate, filter, group, and transform DataFrames in your browser. Practice real-world data wrangling with live Python execution.

Master JSON parsing, manipulation, and transformation with hands-on exercises. Learn to navigate complex data structures, transform API responses, and build data pipelines in your browser.

Learn to analyze data using AI without writing code. Master uploading spreadsheets to ChatGPT and Claude, asking the right questions, finding patterns, creating reports, visualizing data, and cleaning messy datasets.
Understand how data moves through modern systems, no code required. Learn ETL vs ELT, cloud storage with Amazon S3, AWS Glue basics, data validation, and pipeline monitoring, plus how AI tools help you design, explain, and document pipelines.
Turn raw spreadsheets into polished, interactive dashboards using AI, no coding required. Clean data with Copilot and Power Query, write DAX measures with ChatGPT and Claude, auto-generate insights, and ask your data questions in plain English. Beginner-friendly and 100% free with a certificate of completion.